Zapallar
In this article, we will explore the topic of Zapallar in depth, analyzing its origins, evolution, relevance today and possible future developments. Zapallar is a topic widely discussed and studied in different areas, arousing the interest of academics, researchers, professionals and the general public. Throughout history, Zapallar has played a crucial role in various contexts, significantly influencing society, culture and everyday life. Through a comprehensive analysis, we will address the different perspectives and approaches that have been used to understand Zapallar, as well as the implications and challenges it currently poses. Through this article, we seek to offer a comprehensive vision of Zapallar and its impact on society, promoting a constructive and enriching debate on this very relevant topic.
This article's tone or style may not reflect the encyclopedic tone used on Wikipedia. (July 2018) |
Zapallar | |
|---|---|
 Coast of Zapallar | |
| Coordinates: 32°33′13″S 71°27′32″W / 32.55361°S 71.45889°W | |
| Country | |
| Region | |
| Province | Petorca |
| Government | |
| • Type | Municipality |
| • Alcalde | Gustavo Alessandri |
| Area | |
• Total | 288.0 km2 (111.2 sq mi) |
| Elevation | 50 m (160 ft) |
| Population (2017 Census)[2] | |
• Total | 7,339 |
| • Density | 25/km2 (66/sq mi) |
| • Urban | 5,013 |
| • Rural | 2,326 |
| Sex | |
| • Men | 3,704 |
| • Women | 3,635 |
| Time zone | UTC-4 (CLT[3]) |
| • Summer (DST) | UTC-3 (CLST[4]) |
| Area code | 56 + 33 |
| Climate | Csb |
| Website | Municipality of Zapallar |
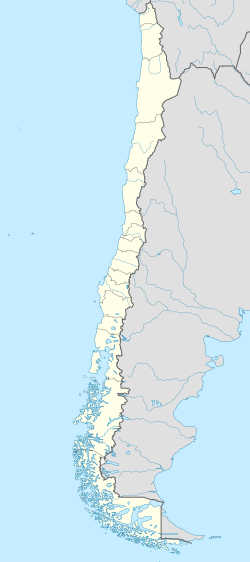
Zapallar is a commune and a town located in Chile's Petorca Province, a part of the Valparaíso Region. It covers 288 km2 (111 square miles) of land. Zapallar is located on the coast of the Pacific Ocean approximately 125 km (78 miles) miles northwest of Santiago.
Demographics
According to the 2002 census of the National Statistics Institute, Zapallar had 5,659 inhabitants (2,914 men and 2,745 women). Of these, 4,744 (83.8%) lived in urban areas and 915 (16.2%) in rural areas. The population grew by 24.3% (1,105 persons) between the 1992 and 2002 censuses.[2]
Administration
As a commune, Zapallar is a third-level administrative division of Chile administered by a communal council, headed by an alcalde who is directly elected every four years. Since 2016 the mayor has been Gustavo Alessandri Bascuñán (Ind./RN). For the 2021–2024 term, the communal council has the following members:[1]
- Luis Guajardo Abarca (RN)
- Josefina Sutil Servoin (UDI)
- Sebastián Chacana Basaez (UDI)
- Danilo Fernández Peña (PS)
- Reinaldo Fernández Silva (Ind./PL)
- Carolina Letelier Riumallo (DC)
The commune of Zapallar belongs to the Electoral District No. 6 (Cabildo, Calera, Hijuelas, La Cruz, La Ligua, Nogales, Papudo, Petorca, Puchuncaví, Quillota, Quintero, Zapallar, Calle Larga, Catemu, Llay Llay, Los Andes, Panquehue, Putaendo, Rinconada, San Esteban, San Felipe, Santa María, Limache, Olmué, Quilpué, Villa Alemana. Zapallar is represented in the Chamber of Deputies by Camila Flores (RN), Diego Ibáñez (RD), Pablo Kast (EVO), Andrés Longton (RN), Carolina Marzán (PPD), Luis Pardo (RN), Marcelo Schilling (PS) and Daniel Verdessy (DC).
Zapallar belongs to the VI Senate Circumscription (Valparaíso). The commune is represented in the Senate by Isabel Allende Bussi (PS), Francisco Chahuán Chahuán (RN), Juan Ignacio Latorre (RD), Kenneth Pugh (IND), Ricardo Lagos Weber (PPD).
Climate
| Climate data for Zapallar | |||||||||||||
|---|---|---|---|---|---|---|---|---|---|---|---|---|---|
| Month | Jan | Feb | Mar | Apr | May | Jun | Jul | Aug | Sep | Oct | Nov | Dec | Year |
| Mean daily maximum °C (°F) | 22.6 (72.7) |
22.1 (71.8) |
19.2 (66.6) |
17.9 (64.2) |
16.0 (60.8) |
14.9 (58.8) |
14.1 (57.4) |
14.6 (58.3) |
15.6 (60.1) |
17.2 (63.0) |
19.4 (66.9) |
21.7 (71.1) |
17.9 (64.3) |
| Daily mean °C (°F) | 17.7 (63.9) |
17.6 (63.7) |
16.2 (61.2) |
14.1 (57.4) |
12.8 (55.0) |
11.9 (53.4) |
11.2 (52.2) |
11.5 (52.7) |
12.2 (54.0) |
13.4 (56.1) |
14.8 (58.6) |
16.6 (61.9) |
14.2 (57.5) |
| Mean daily minimum °C (°F) | 14.0 (57.2) |
14.1 (57.4) |
13.0 (55.4) |
11.1 (52.0) |
10.0 (50.0) |
9.2 (48.6) |
8.4 (47.1) |
8.5 (47.3) |
9.2 (48.6) |
10.2 (50.4) |
11.2 (52.2) |
12.6 (54.7) |
11.0 (51.7) |
| Average precipitation mm (inches) | 3.1 (0.12) |
0.9 (0.04) |
1.4 (0.06) |
13.5 (0.53) |
71.8 (2.83) |
120.5 (4.74) |
76.1 (3.00) |
54.2 (2.13) |
28.8 (1.13) |
9.9 (0.39) |
2.5 (0.10) |
1.6 (0.06) |
384.3 (15.13) |
| Average relative humidity (%) | 80 | 80 | 83 | 85 | 86 | 86 | 85 | 84 | 84 | 82 | 80 | 78 | 83 |
| Source: Bioclimatografia de Chile[5] | |||||||||||||
See also
References
- ^ a b "Municipal Authorities" (in Spanish). Archived from the original on 5 December 2023. Retrieved 1 November 2024.
- ^ a b c d "Resultados CENSO 2017". National Statistics Institute of Chile (in Spanish). Retrieved 1 November 2024.
- ^ "Chile Time". WorldTimeZones.org. Archived from the original on September 11, 2007. Retrieved 2010-07-28.
- ^ "Chile Summer Time". WorldTimeZones.org. Archived from the original on September 11, 2007. Retrieved 2010-07-28.
- ^ Hajek, Ernst; Castri, Francesco (1975). "Bioclimatografia de Chile" (PDF) (in Spanish). Archived from the original (PDF) on 22 November 2009. Retrieved 27 May 2024.
External links
- (in Spanish) Municipality of Zapallar


