Taquari
In this article, we will delve into the fascinating world of Taquari, exploring its many facets and learning more about its impact on different aspects of society. From its origin to its relevance today, we will take a detailed look at Taquari and its influence on the environment around it. Through an exhaustive analysis, we will discover the different perspectives that exist around Taquari, as well as its importance in the development of different fields of study. Without a doubt, Taquari is a fascinating topic that deserves to be explored and analyzed in depth, which is why we will be diving into its depths throughout this article.
City of Taquari | |
|---|---|
 Armenian Lagoon | |
| Nickname(s): Taquari, people's land | |
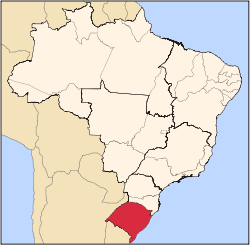
 Location in Rio Grande do Sul, Brazil | |
| Coordinates: 29°48′00″S 51°51′35″W / 29.80000°S 51.85972°W | |
| Country | Brazil |
| Region | South |
| State | Rio Grande do Sul |
| Founded | 1849 |
| Government | |
| • Mayor | Emanuel Hassen de Jesus (PT) |
| Area | |
• Total | 349 km2 (135 sq mi) |
| Elevation | 54 m (177 ft) |
| Population (2022 [1]) | |
• Total | 25,198 |
| Time zone | UTC−3 (BRT) |
| Website | Prefeitura de Taquary |
Taquari is a municipality in the state of Rio Grande do Sul, Brazil.
Climate
| Climate data for Taquari (1976–2005) | |||||||||||||
|---|---|---|---|---|---|---|---|---|---|---|---|---|---|
| Month | Jan | Feb | Mar | Apr | May | Jun | Jul | Aug | Sep | Oct | Nov | Dec | Year |
| Record high °C (°F) | 36.4 (97.5) |
35.7 (96.3) |
34.9 (94.8) |
32.2 (90.0) |
29.4 (84.9) |
28.0 (82.4) |
28.9 (84.0) |
30.2 (86.4) |
31.3 (88.3) |
33.3 (91.9) |
34.9 (94.8) |
36.0 (96.8) |
36.4 (97.5) |
| Mean daily maximum °C (°F) | 30.5 (86.9) |
30.0 (86.0) |
28.7 (83.7) |
25.3 (77.5) |
22.0 (71.6) |
19.3 (66.7) |
19.3 (66.7) |
20.4 (68.7) |
21.8 (71.2) |
24.7 (76.5) |
27.0 (80.6) |
29.3 (84.7) |
24.9 (76.7) |
| Daily mean °C (°F) | 24.9 (76.8) |
24.7 (76.5) |
23.4 (74.1) |
20.1 (68.2) |
16.8 (62.2) |
14.5 (58.1) |
14.5 (58.1) |
15.3 (59.5) |
16.8 (62.2) |
19.4 (66.9) |
21.4 (70.5) |
23.6 (74.5) |
19.6 (67.3) |
| Mean daily minimum °C (°F) | 19.3 (66.7) |
19.4 (66.9) |
18.2 (64.8) |
14.9 (58.8) |
11.7 (53.1) |
9.7 (49.5) |
9.6 (49.3) |
10.2 (50.4) |
11.8 (53.2) |
14.1 (57.4) |
15.8 (60.4) |
17.8 (64.0) |
14.4 (57.9) |
| Record low °C (°F) | 13.5 (56.3) |
13.9 (57.0) |
12.0 (53.6) |
7.6 (45.7) |
4.0 (39.2) |
1.3 (34.3) |
1.1 (34.0) |
2.3 (36.1) |
4.0 (39.2) |
7.0 (44.6) |
9.4 (48.9) |
12.0 (53.6) |
1.1 (34.0) |
| Average precipitation mm (inches) | 148 (5.8) |
127 (5.0) |
118 (4.6) |
116 (4.6) |
117 (4.6) |
124 (4.9) |
149 (5.9) |
123 (4.8) |
149 (5.9) |
179 (7.0) |
131 (5.2) |
135 (5.3) |
1,616 (63.6) |
| Average relative humidity (%) | 77 | 79 | 81 | 84 | 85 | 86 | 85 | 83 | 81 | 79 | 75 | 74 | 81 |
| Source 1: Empresa Brasileira de Pesquisa Agropecuária (EMBRAPA)[2] | |||||||||||||
| Source 2: Climatempo (precipitation)[3] | |||||||||||||
See also
References
- ^ IBGE 2022
- ^ "Atlas climático da Região Sul do Brasil: Estados do Paraná, Santa Catarina e Rio Grande do Sul" (PDF). EMBRAPA. Archived from the original (PDF) on 14 January 2024. Retrieved 25 May 2024.
- ^ "Climatologia em Taquari, BR". Climatempo. Retrieved 25 May 2024.


