Innings pitched
| This article needs additional citations for verification. Please help improve this article by adding citations to reliable sources. Unsourced material may be challenged and removed. Find sources: "Innings pitched" – news · newspapers · books · scholar · JSTOR (April 2020) (Learn how and when to remove this message) |
 Cy Young holds the major-league record for innings pitched with 7,356 during his career.
In baseball, the statistic innings pitched (IP) is the number of innings a pitcher has completed, measured by the number of batters and baserunners that have been put out while the pitcher is on the pitching mound in a game. Three outs made is equal to one inning pitched. One out counts as one-third of an inning, and two outs as two-thirds of an inning. Sometimes, the statistic is written 34.1, 72.2, or 91.0, for example, to represent 34+1⁄3 innings, 72+2⁄3 innings, and 91 innings exactly, respectively.
Runners left on base by a pitcher are not counted in determining innings pitched. It is possible for a pitcher to enter a game, give up several hits and possibly even several runs, and be removed before achieving any outs, thereby recording a total of zero innings pitched. Alternatively, it is possible for a pitcher to enter a situation where there are two runners on base and no outs. He could throw one pitch that results in a triple play, and for that one pitch he would be credited with a full inning pitched.
Decline
In Major League Baseball, the only active players in the top 100 all-time at the end of the 2009 season were Tom Glavine (ranked 30th with 4,413+1⁄3 IP), Randy Johnson (ranked 38th with 4,135+1⁄3), Jamie Moyer (ranked 45th with 3,908+2⁄3) and John Smoltz (ranked 74th with 3473). By the end of the 2018 season, only two active players were in the top 100 all-time: CC Sabathia (ranked 73rd with 3470), and Bartolo Colón (ranked 74th with 3461+2⁄3). This is because over time, innings pitched have declined. Several factors are responsible for this decline:
- From 1876 to 1892, pitchers threw from fifty feet and exerted less stress on their arms (also pitchers often threw underhand in this era). In this era, season totals of 600 innings pitched were not uncommon.
- In 1893, the mound (the pitching rubber, to be more precise) was moved back to the current distance of sixty feet, six inches. However, they still often threw 400 innings in a season. This was because the home run was far less common and pitchers often conserved arm strength throughout the game.
- From 1920 to the 1980s, the four-man pitching rotation was well established. Pitchers could no longer throw 400 innings in a season, as the home run meant a run could be scored at any time. The league leader in innings pitched often threw somewhat more than 300 innings. Occasionally, innings pitched would spike, as in the early 1970s, when Wilbur Wood pitched 376+2⁄3 innings in 1972 and then 359+1⁄3 innings in 1973.
- From the 1980s to the present, the four-man rotation was replaced with the five-man rotation, with a weak fifth man who would often be skipped on off days. Also, managers starting using their bullpens more and more, accelerating the decline in innings pitched. As of the start of the 2022 season no pitcher has thrown 250 innings since Justin Verlander in 2011.
Records
All-time leaders
 Pud Galvin accrued over 6000 innings pitched during his major-league career.
| Rank | Player | Innings pitched |
|---|---|---|
| 1 | Cy Young | 7,356 |
| 2 | Pud Galvin | 6,003+1⁄3 |
| 3 | Walter Johnson | 5,914+1⁄3 |
| 4 | Phil Niekro | 5,404 |
| 5 | Nolan Ryan | 5,386 |
| 6 | Gaylord Perry | 5,350 |
| 7 | Don Sutton | 5,282+1⁄3 |
| 8 | Warren Spahn * | 5,243+2⁄3 |
| 9 | Steve Carlton * | 5,217+2⁄3 |
| 10 | Grover Cleveland Alexander | 5,190 |
| 11 | Kid Nichols | 5,067+1⁄3 |
| 12 | Tim Keefe | 5,049+2⁄3 |
| 13 | Greg Maddux | 5,008+1⁄3 |
| 14 | Bert Blyleven | 4,970 |
| 15 | Bobby Mathews | 4,956 |
| 16 | Roger Clemens | 4,916+2⁄3 |
| 17 | Mickey Welch | 4,802 |
| 18 | Christy Mathewson | 4,788+2⁄3 |
| 19 | Tom Seaver | 4,783 |
| 20 | Tommy John * | 4,710+1⁄3 |
| * Pitched left-handed Active players in bold Through 2016 season | ||
Single-season leaders
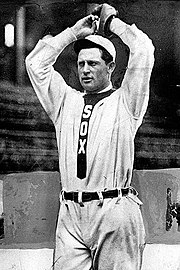
 Ed Walsh holds the major-league record for innings pitched in a single season.
| Rank | Player | Year | Team | Innings pitched |
|---|---|---|---|---|
| 1 | Ed Walsh | 1908 | Chicago White Sox | 464 |
| 2 | Jack Chesbro | 1904 | New York Highlanders | 454+2⁄3 |
| 3 | Joe McGinnity | 1903 | New York Giants | 434 |
| 4 | Ed Walsh | 1907 | Chicago White Sox | 422+1⁄3 |
| 5 | Vic Willis | 1902 | Boston Beaneaters | 410 |
| 6 | Joe McGinnity | 1904 | New York Giants | 408 |
| 7 | Ed Walsh | 1912 | Chicago White Sox | 393 |
| 8 | Dave Davenport | 1915 | St. Louis Terriers | 392+2⁄3 |
| 9 | Christy Mathewson | 1908 | New York Giants | 390+2⁄3 |
| 10 | Jack Powell | 1904 | New York Highlanders | 390+1⁄3 |
References
- ^ "Pitching Season Finder (Single seasons, IP>=390)". Baseball Reference. Retrieved July 28, 2017.